
FTC analysis of unreported GAFAM transactions
On 15 September, the FTC released results of its investigation into a decade (2010-2019) of unreported transactions by the biggest technology companies, Apple, Microsoft, Alphabet, Amazon and Facebook (GAFAM).
First of all, it is interesting to see how many non-HRS reportable transactions GAFAM were involved in. On average, the FTC identified around one hundred per year. In 54%¹ of the transactions the parties acquired assets and/or gained control of the target (“control/asset transactions”). For these and a small number of other types, covering in total 61% of all unreported transactions, the report contains size of transaction; age, industry and location of target; and further details on the deal structure. For example, 65% of these transactions had a deal value of between $1m and $25m; 35% contained a non-US target; in about half the target was less than 5 years old; 79% used deferred or contingent compensation; and 77% contained non-compete clauses.
Unfortunately, the FTC does not publish comparable statistics for notified mergers. Therefore we do not know which share of transaction has not been notified. For that reason and due to a few other design choices, it is also difficult to compare to my previous analysis on this topic.
However, if I assume that all acquisitions (excluding stakes) reported in Wikipedia correspond to control/asset transactions; that all small transactions (<$1m) reported by the FTC are control/asset transactions; and that I correctly identified notified mergers, my analysis covers around 80% of all unreported control/asset transactions in addition to notified transactions, which are not reported by the FTC.
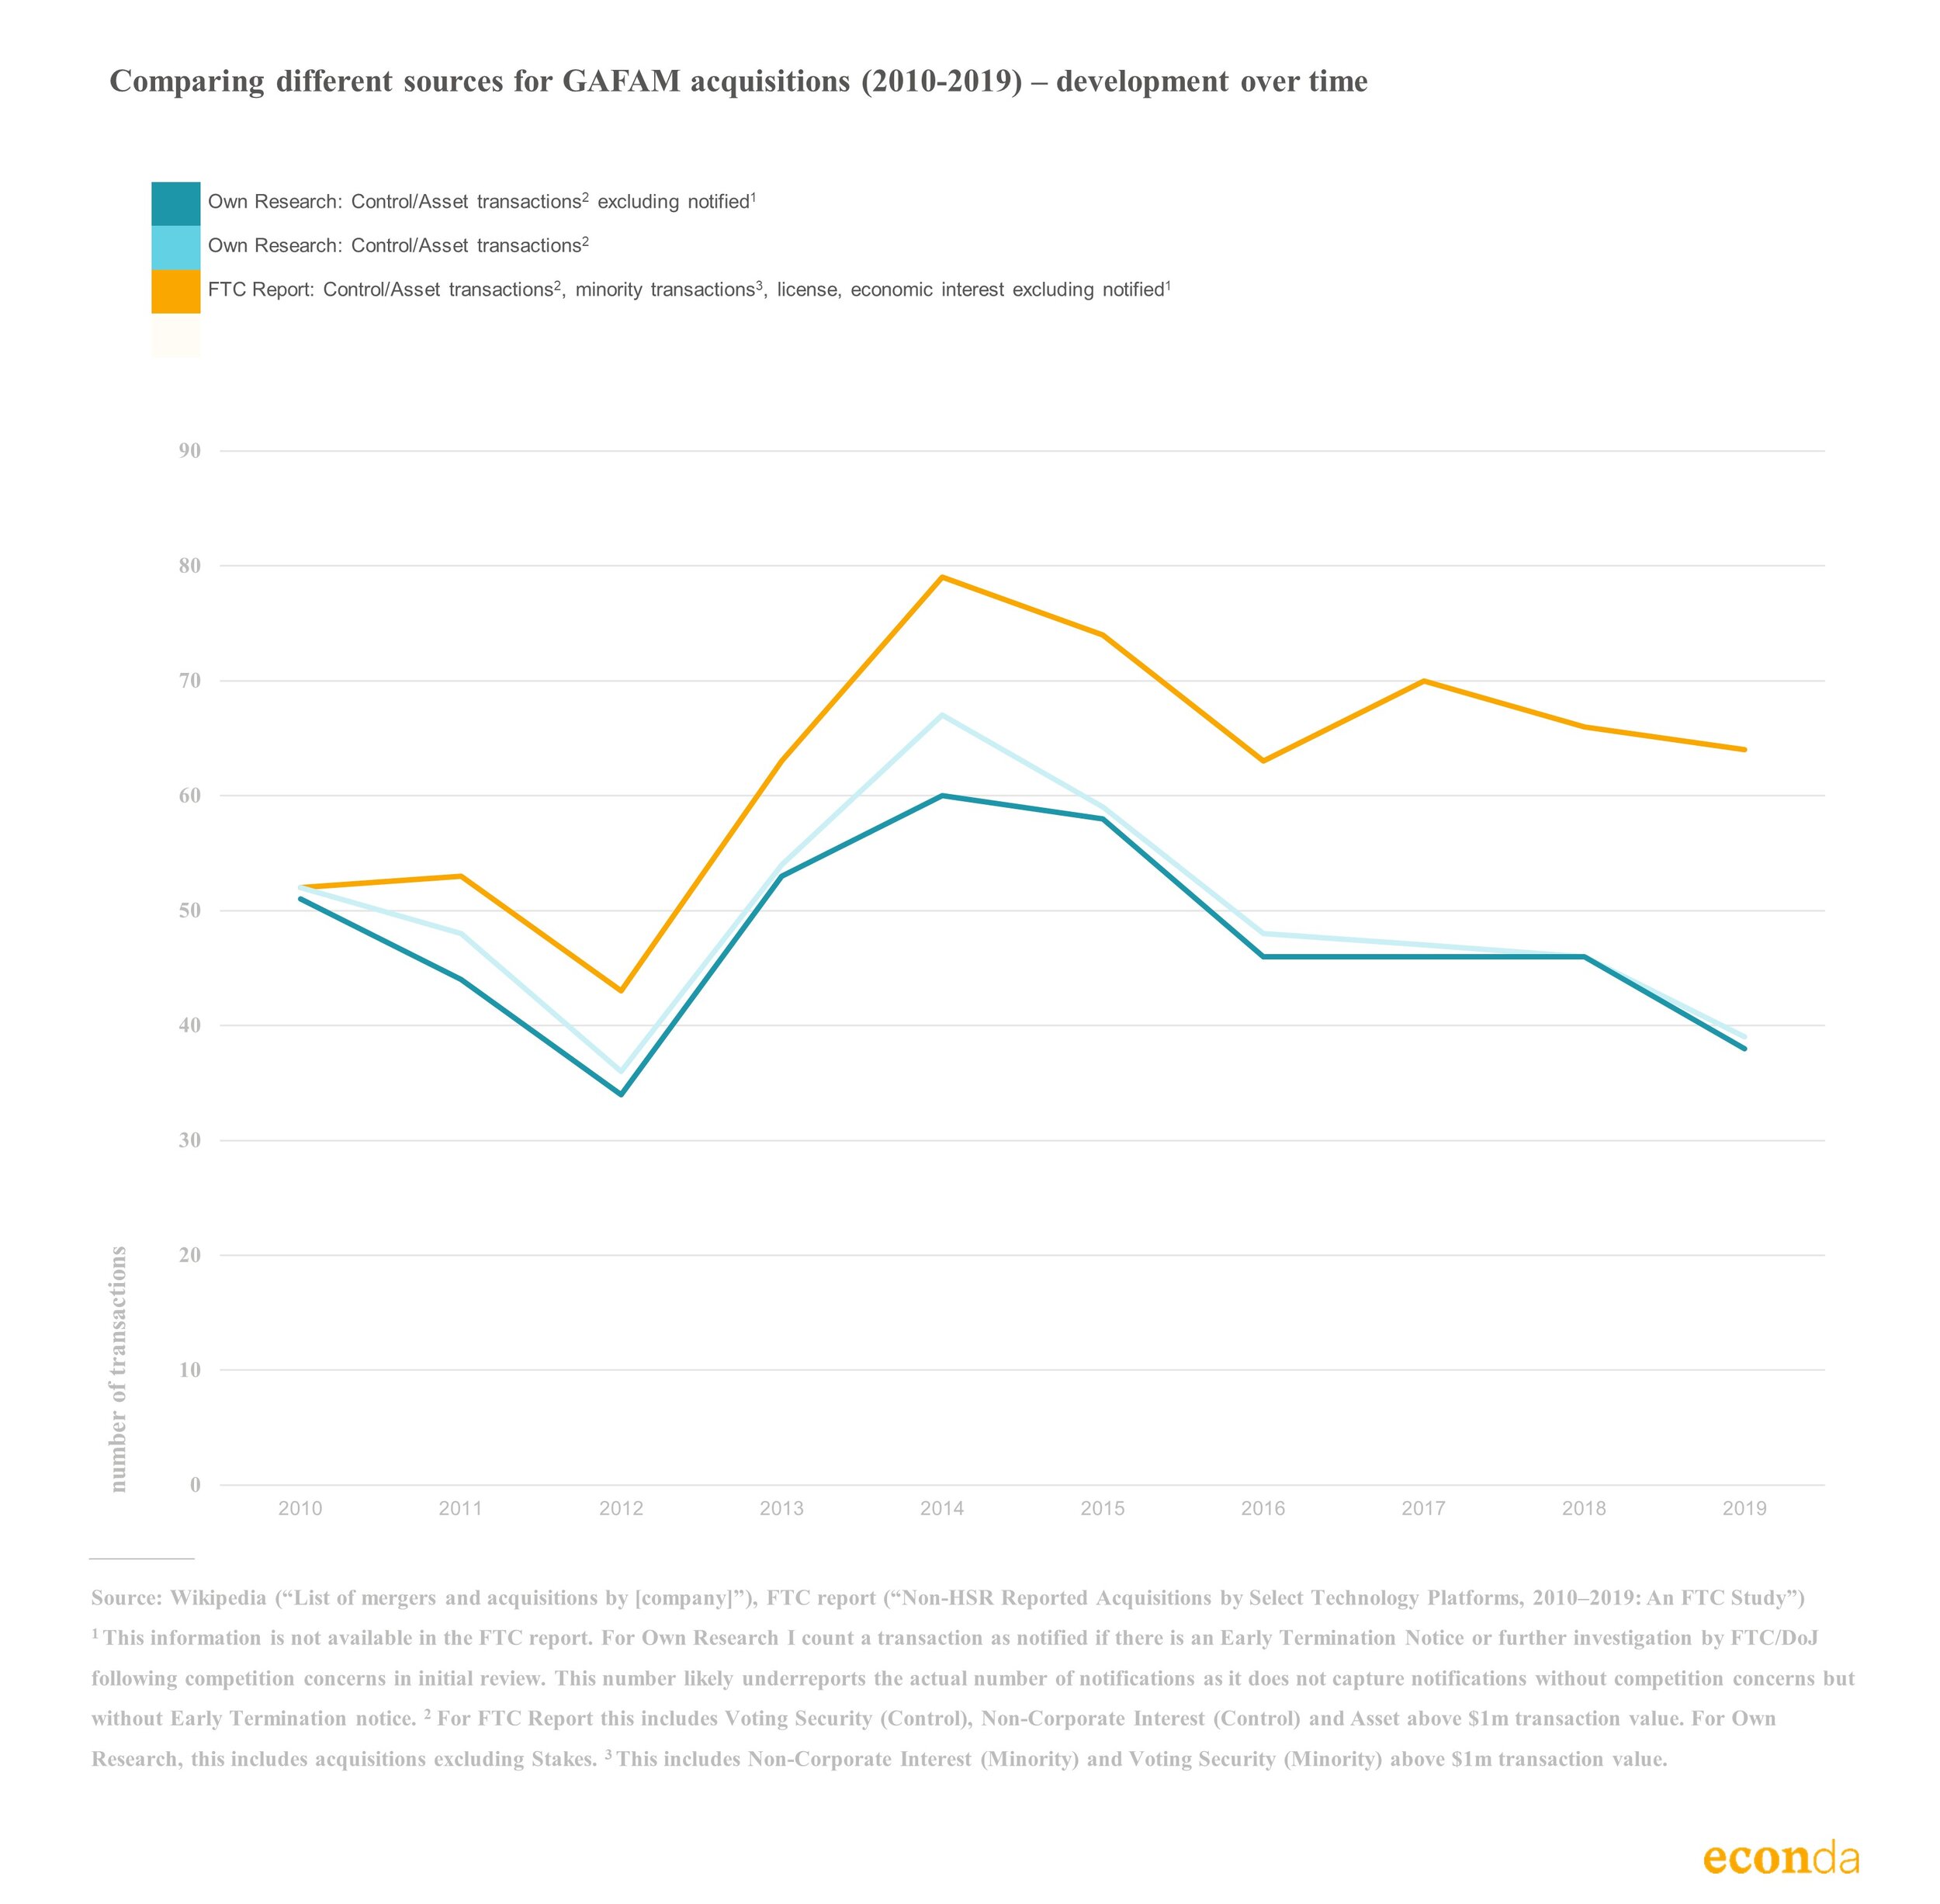
Comparing the development over time, both analyses conclude that the peak of transactions was reached in 2014 and that transactions were at their lowest in 2012. However, according to the FTC the fall in transactions after 2014 was less step than reported in my analysis. The divergence could in part be due to Wikipedia not capturing minority stakes or other economic interest (or not in sufficient quality to use for analysis), if these increased over time. Splitting these out is unfortunately not possible based on the FTC report
The biggest shortcoming of the data source I use (Wikipedia) seems to be that the transaction value is missing in the large majority of cases. This makes it difficult to assess whether certain types of transactions (larger or smaller) are missing more systematically and which of the transactions met the HRS SOT threshold. It would be interesting to see whether proprietary databases such as PitchBook, S&P Global Market Intelligence 451 Research, Crunchbase and Refinitiv provide more information both on number of transactions and deal value.
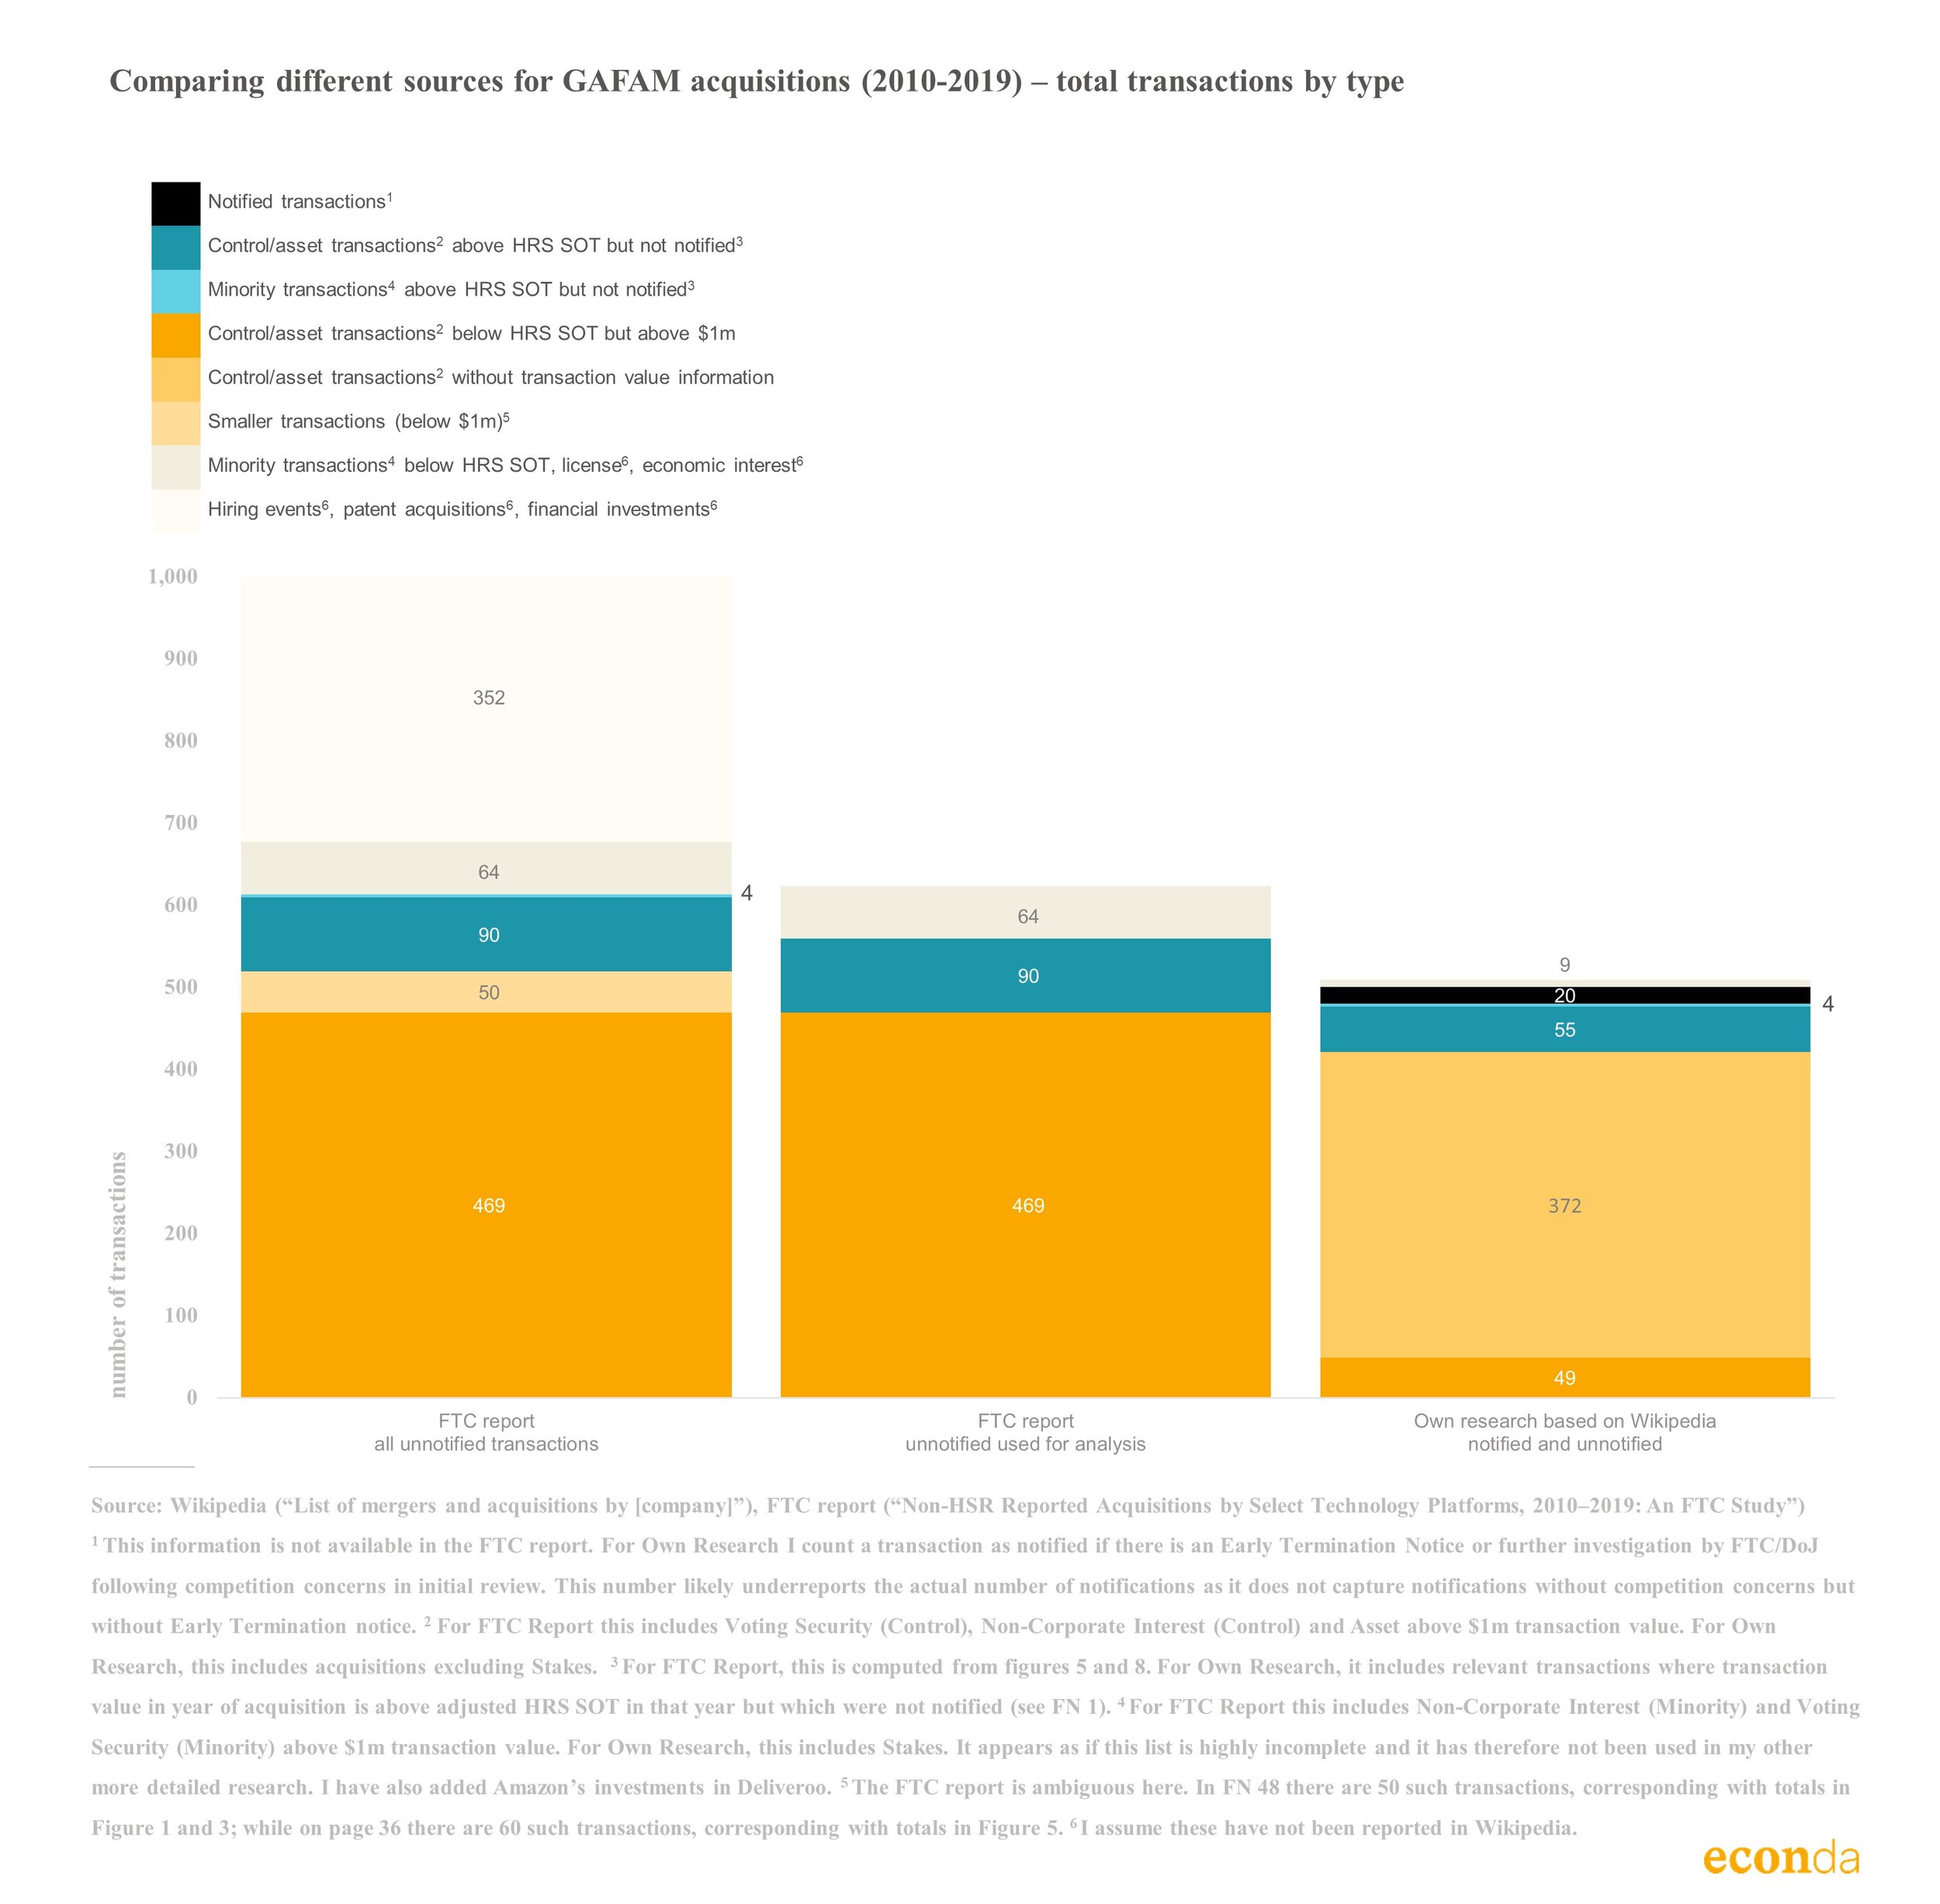
¹ For transactions below $1m the transaction type is not disclosed. If these are all asset or control transactions, the share increases to 59%. Control transactions include voting security (control) and non-corporate interest (control) as per FTC report.