
GAFAM merger reviews
Given the ongoing discussion on a lack of regulatory scrutiny for digital market mergers in general and Google, Apple, Facebook, Amazon and Microsoft (GAFAM) mergers in particular, I wanted to check how many of these have actually been investigated. As discussed previously, this involved manually checking the websites of competition authorities (or relying on a search engine/industry knowledge) and therefore might be somewhat error prone. However, I think it is still useful to do so, to provide some empirical evidence to the discussion. To keep the task manageable, I focus on three jurisdictions, the US (DoJ, FTC), the EU (DG Comp) and the UK (CMA and predecessors), and on the larger acquisitions.
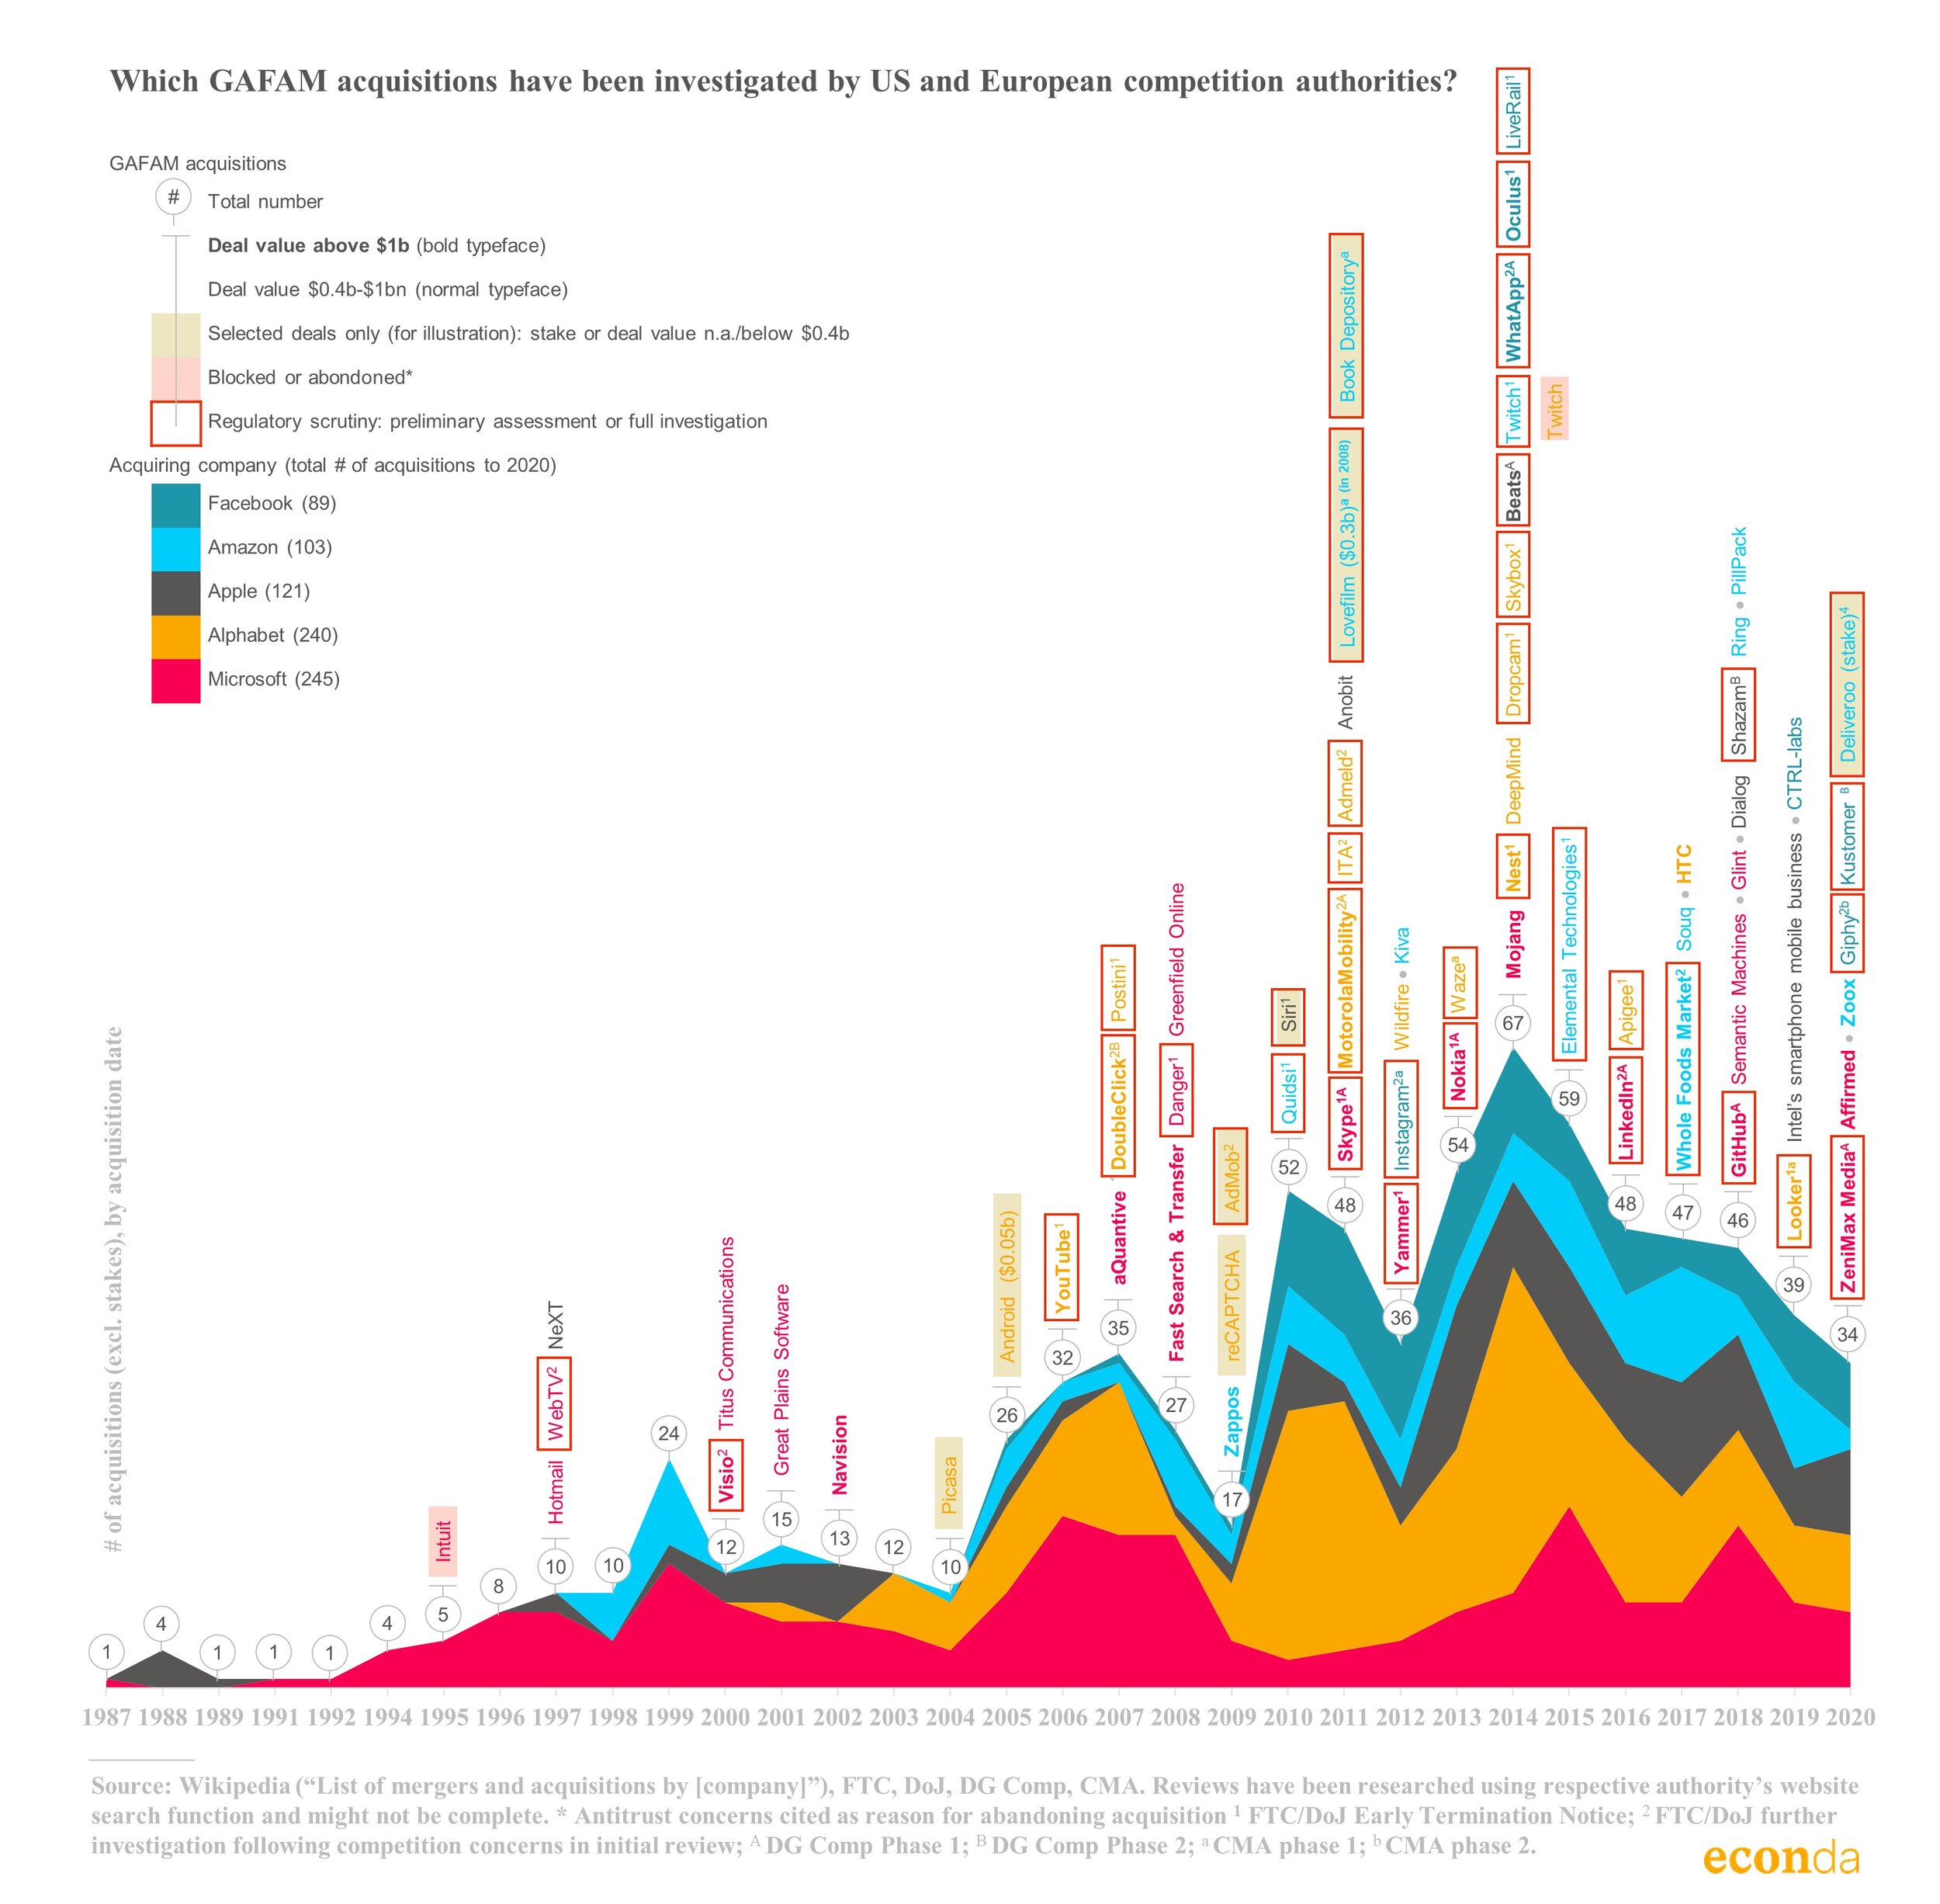
The total number of GAFAM acquisitions peaked in 2014, after which we see a gradual decline.¹ This is despite an increase in general merger activity during this period up until 2017.² Microsoft and Google account for the largest share (each around 30%), while Apple (15%), Amazon (13%) and Facebook (11%) follow suit.
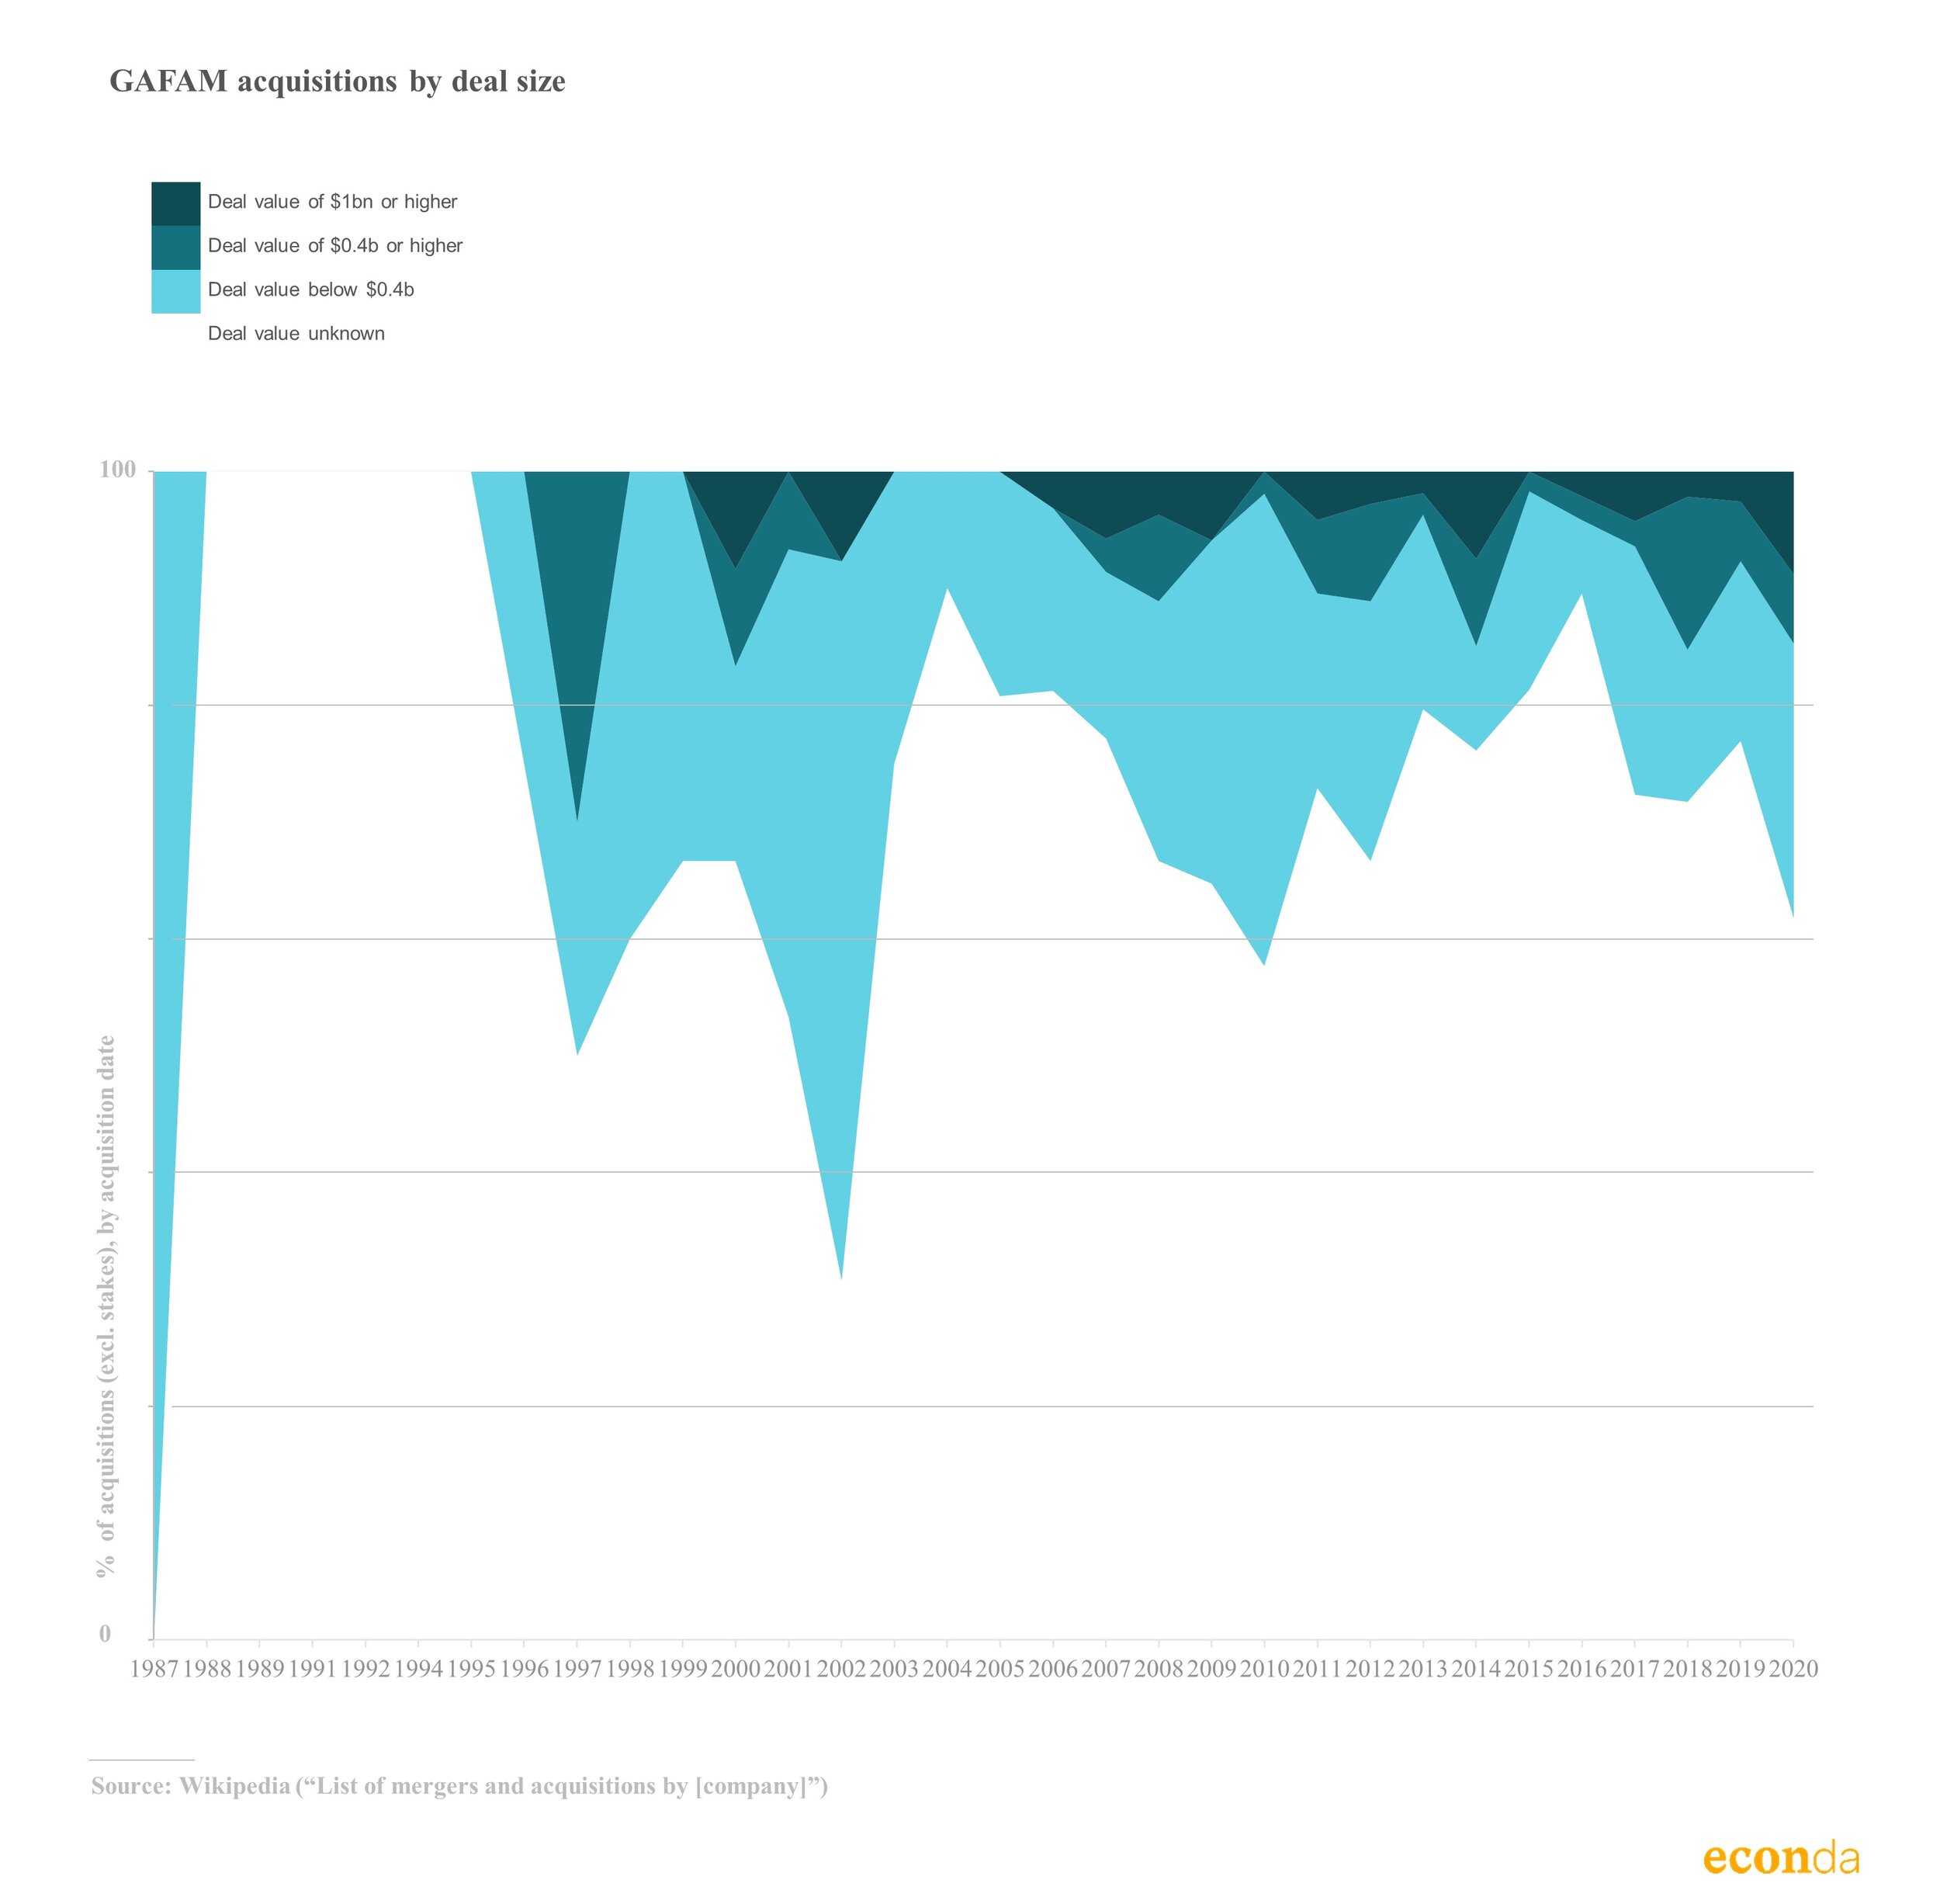
Many of the deals are relatively small.³ Only 7% have a known deal value of $400m or higher and only 3% one of $1bn or higher.
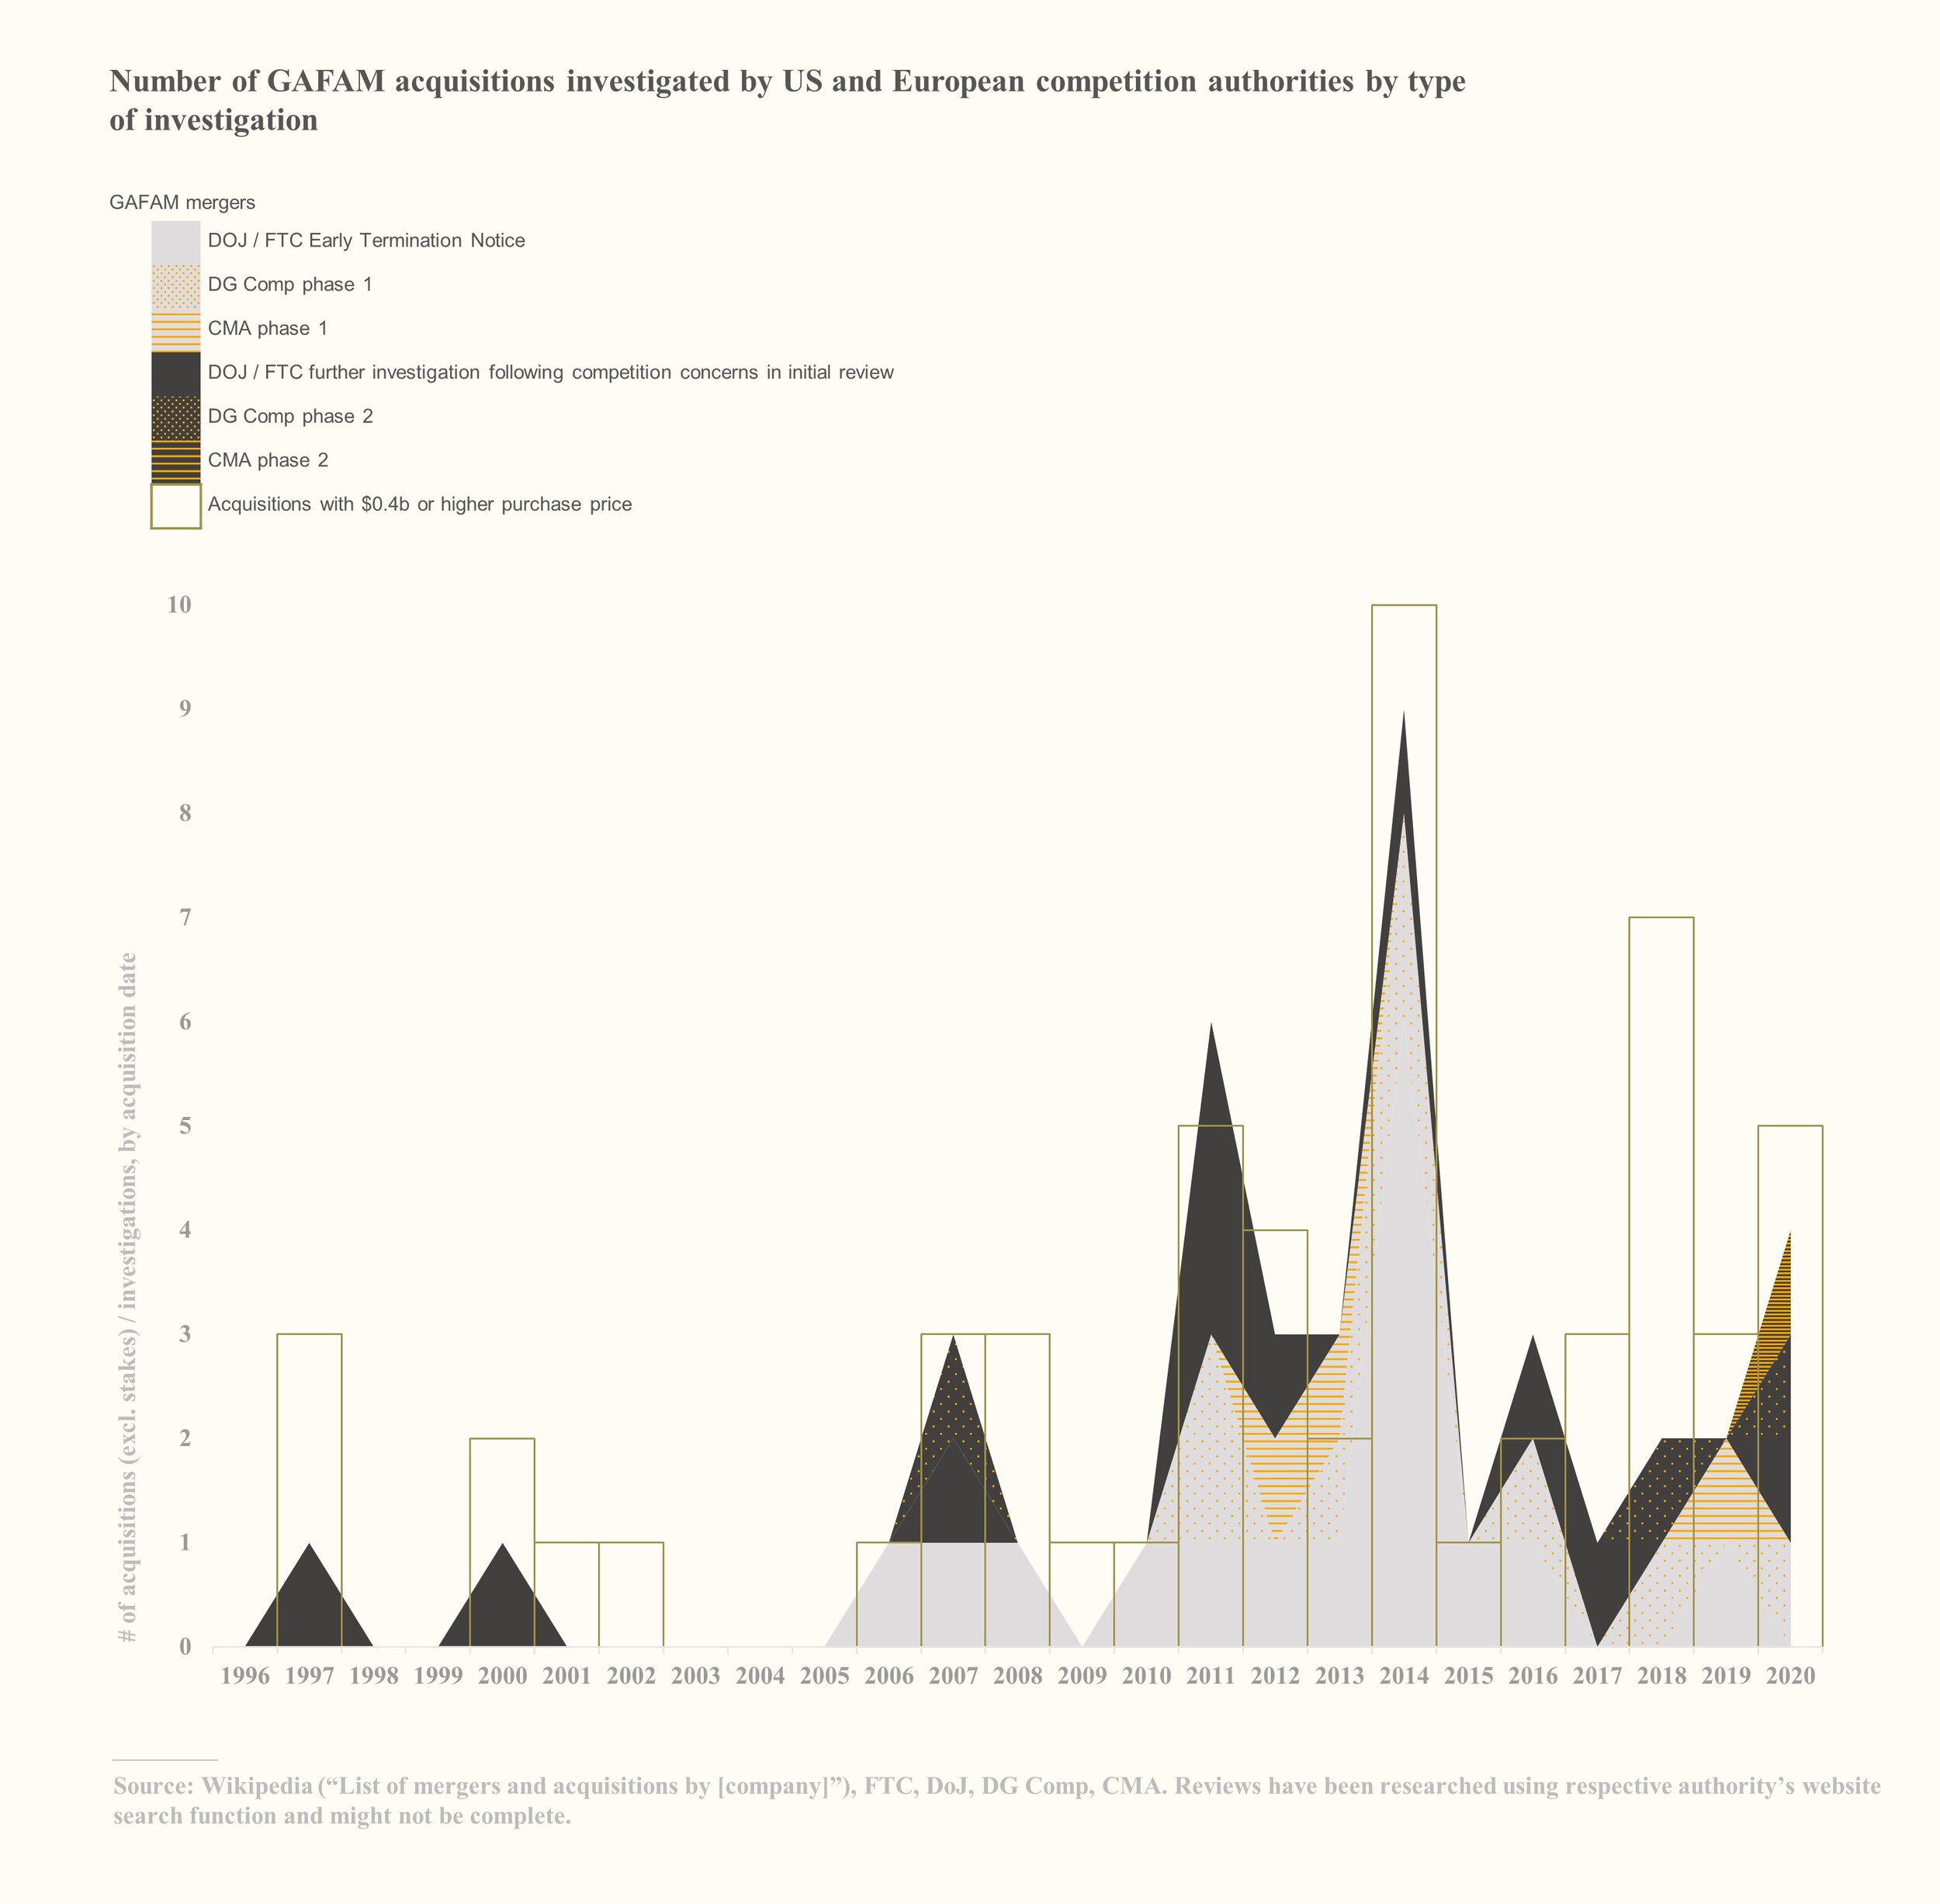
The majority of deals above $400m have been scrutinised by US, EU and / or UK competition authorities to various degrees.⁴ At least 34% of these acquisitions have been cleared in the US or Europe after an initial review, at least 22% have been followed up with a more in depth investigation.⁵ While none was blocked, it is reported that two were abandoned due to regulatory concerns.
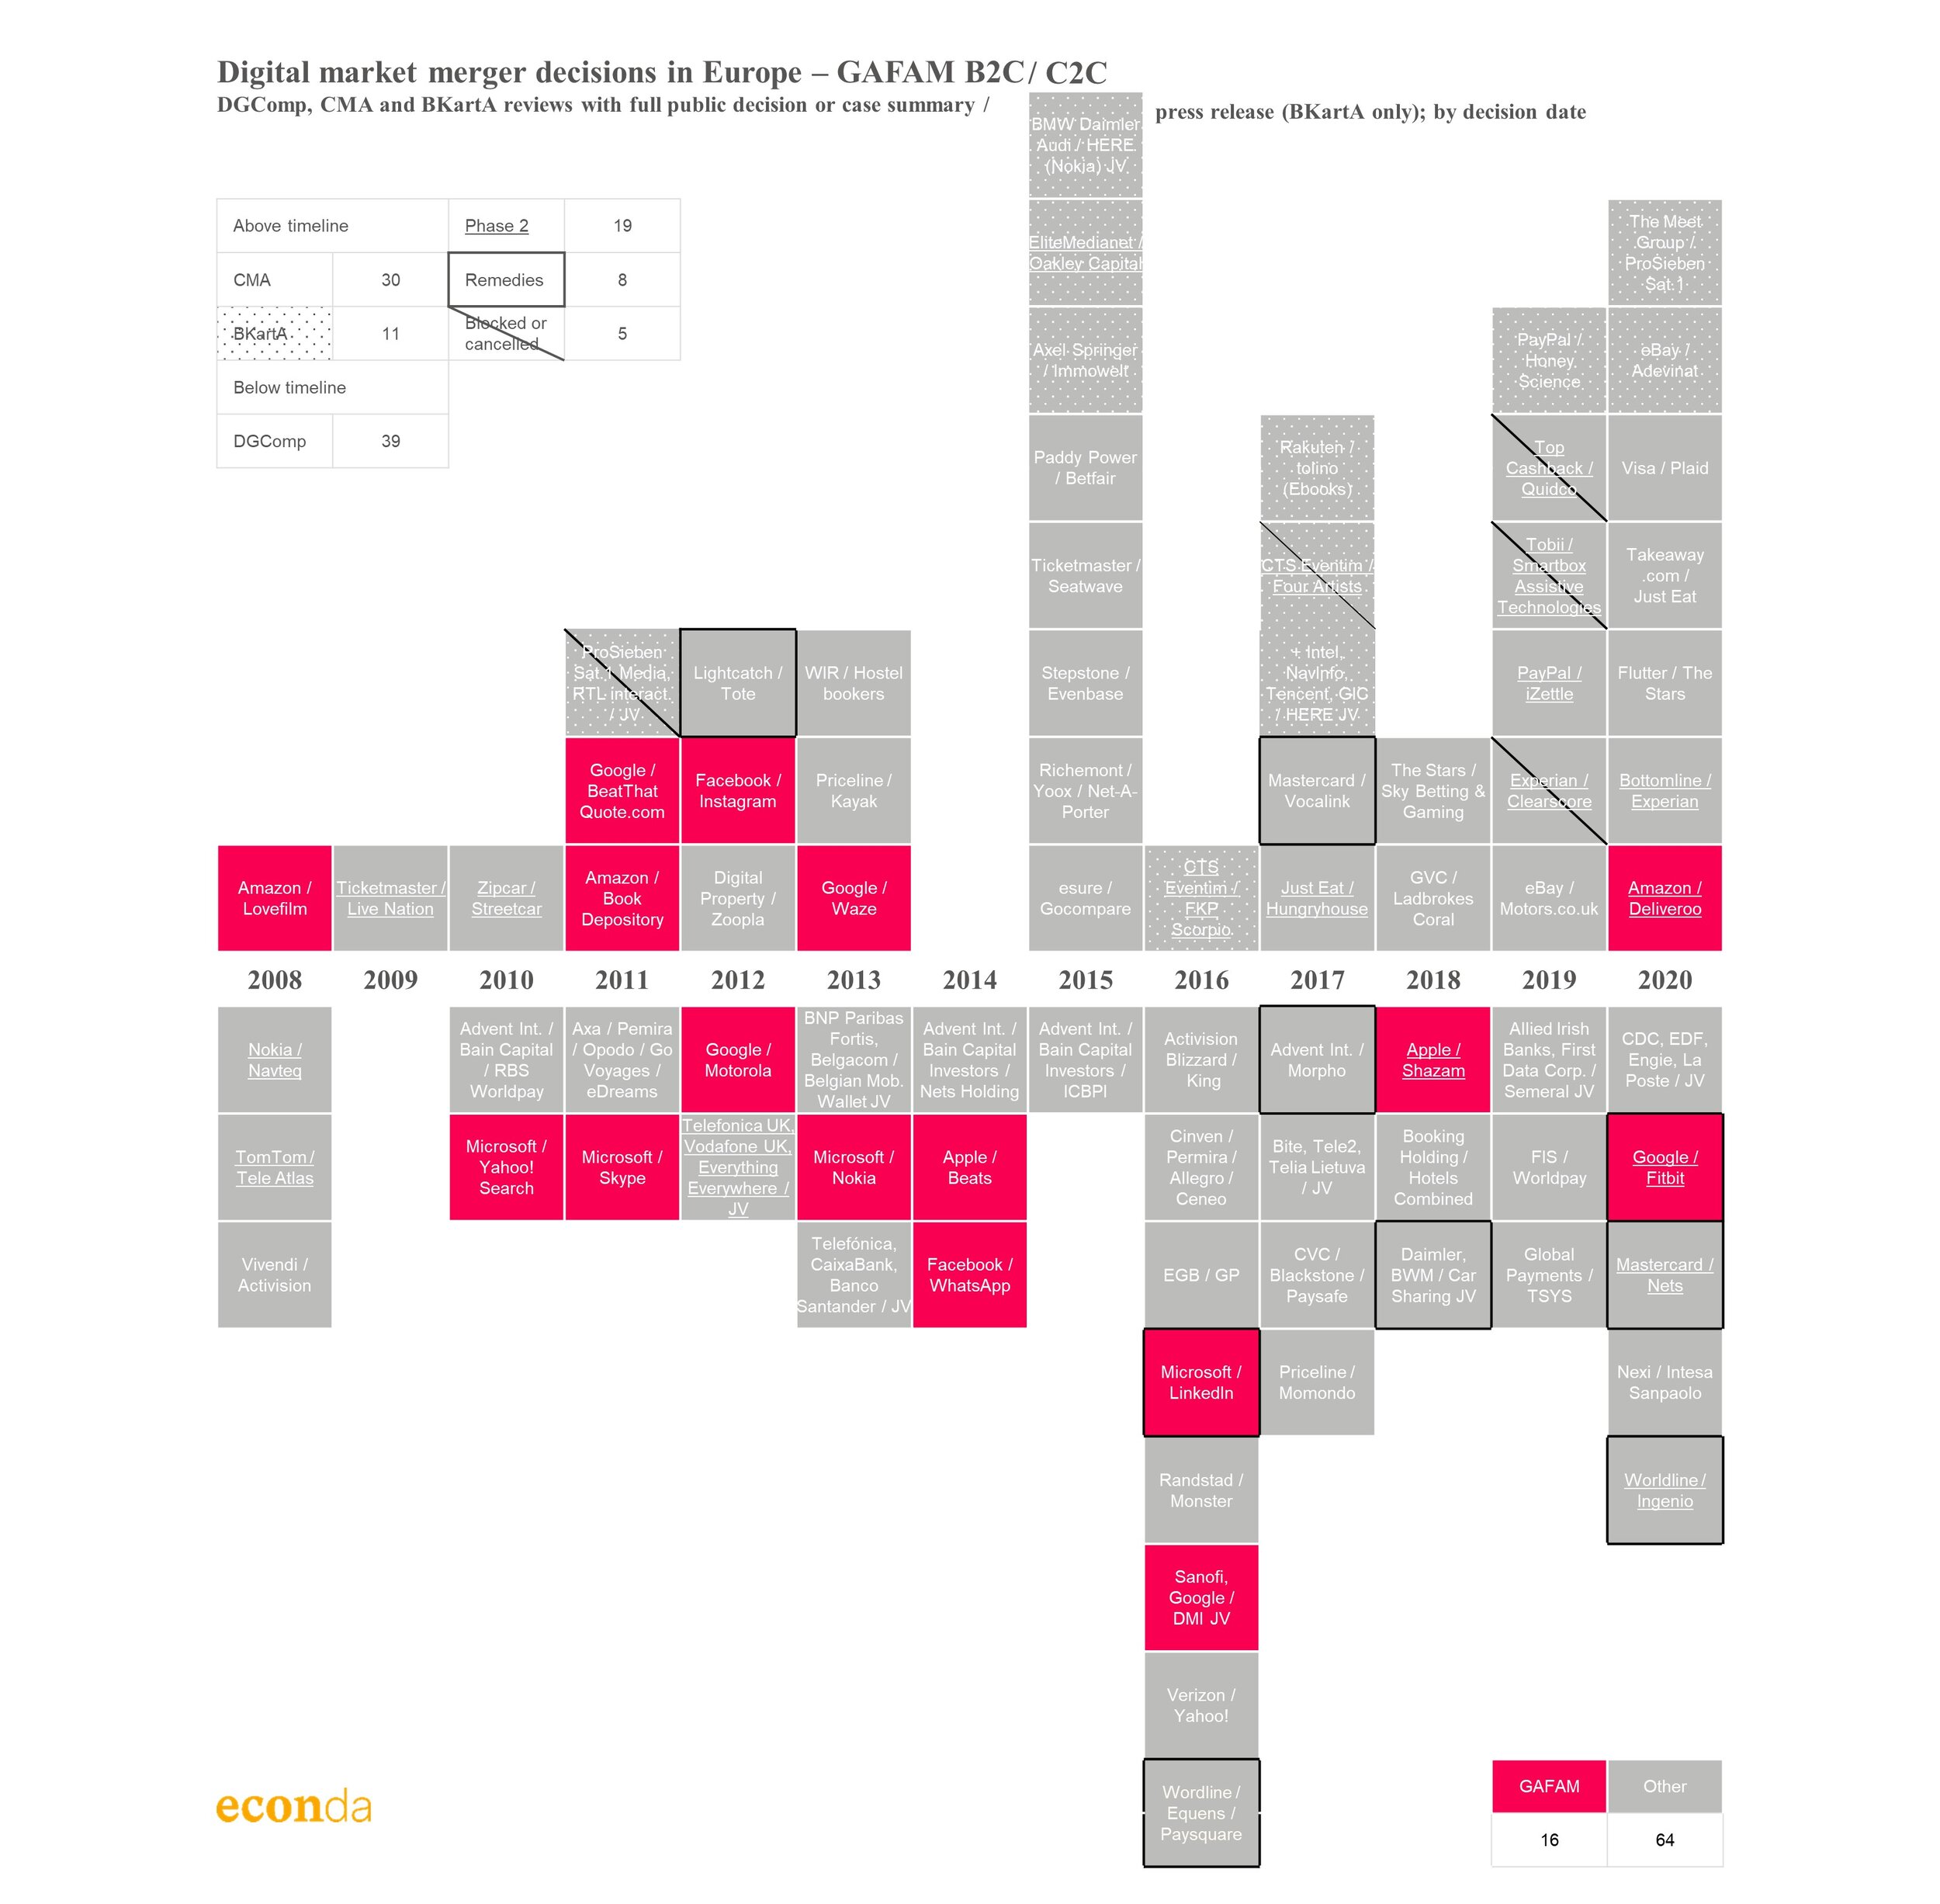
Looking more closely at the acquisitions scrutinised in Europe, I find that acquisitions involving GAFAM make up around 20% of C2C / C2B digital merger reviews by DG Comp, CMA and BKartA while only 8% of the B2B ones. My recent blogpost on Digital Merger Reviews in Europe explains the underlying data set in detail.
While slightly less of the B2C / C2C GAFAM (as compared to non-GAFAM) merger reviews led to an in depth investigation (19% vs 25%), they resulted somewhat more often in remedies (12.5% vs 9%).

¹ The data is collected from Wikipedia (“List of mergers and acquisitions by [company]”) and excludes stakes.
² See https://imaa-institute.org/mergers-and-acquisitions-statistics/
³ In the majority of cases, the deal size is unknown. While it is possible that the acquisition value was $0.4b or higher in these cases, I assume it is more likely that the value is small and therefore has escaped the public radar.
⁴ I chose to cut off at $400m as, in an initial search, I found relatively few competition investigations for acquisitions with a lower deal value but a few investigations at exactly this value. Those smaller acquisitions for which I have found a review in this initial search are highlighted in the first figure but are excluded from further analysis. The cut-off is also in a similar ballpark as the recently introduced German merger transaction value threshold ($400m), aiming to capture smaller tech deals.
⁵ I count towards “initial reviews”, notifications in the US which received an Early Termination Notice and DG Comp / CMA phase 1 reviews. This underestimates the actual number of such early screenings as a number of US notifications might not have received such a notice. FTC / DOJ cases where the initial review raised competition concerns and DG Comp / CMA phase 2 investigation are counted towards “more in depth investigations”. For the US, it can again not be ascertained that this covers all such investigations if such information is not published on the FTC / DOJ website.